Price:
1918 EUR
Contact
École Polytechnique Fédérale de Lausanne
Description
Imagine you want to design the following educational scenario. First, your students solve a problem individual. Next, you form pairs of students who obtained different solutions and ask them to choose the best of their two solutions. Finally, you display the produced solutions and compare them in your final lecture. This scenario needs to be managed dynamically: collecting individual solutions, forming pairs, collecting pair solutions and displaying them. It also requires opportunistic timing: you would like all individuals to complete their solution before moving to the team activity but you don’t want to have many students waiting too long because one has not yet finished. These operations (timing transitions, collecting data, forming pairs) implement the orchestration of the designed scenario.
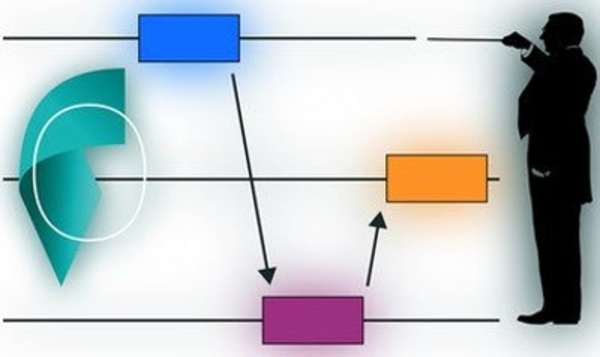
For designing this kind of lesson plan, this MOOC proposes a visual model, called orchestration graph. The vertices of the graph are the learning activities. Learners perform some of these activities individually; some activities are done in teams and some with the whole class. The edges of the graph connect consecutive activities. They are associated to operators that transform the data structures produced by learners during a learning activity into the data structures necessary to run the next activity. A graph of operators hence constitutes a workflow. The edges also describe why an activity is necessary for the next activity: is it a cognitive pre-requisite, a motivational trick, an advanced organizer, an organizational need, etc.
The participants will first acquire the concepts by sketching graphs on paper and will next learn to use FROG, an online platform for Fabricating and Running Orchestrating Graphs.
Specific details
Category of Education
Education