Price:
240 EUR
Contact
Davidson College
Description
Power BI is a robust business analytics and visualization tool from Microsoft that helps data professionals bring their data to life and tell more meaningful stores.
This four-week course is a beginner's guide to working with data in Power BI and is perfect for professionals. You'll become confident in working with data, creating data visualizations, and preparing reports and dashboards.
Take this course if you are a:
Beginner level data professional
Student, Researcher, or Academic
Marketing analyst, business and data analyst, or financial analyst
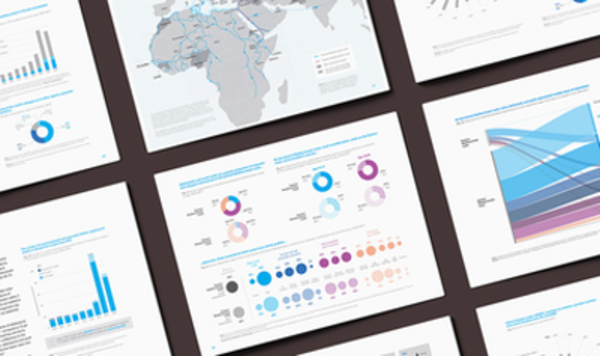
Image Attribution: "Data visualization & Infographic/UNICEF reports Vol. 1" by Shangning Wang, Olga Oleszczuk is licensed under CC BY-NC-ND 4.0
Specific details
Category of Education
Business and Economics
